Experiment 1: Batch Saponification Reaction of Et(Ac) and NaOH
CHEN3010/ CHEN5040 - Chemical Reaction Engineering - S1 2025
Prelab module for experiment 1 Can be accessed here.
Objective
To find the reaction rate constant in a stirred batch reactor.
The saponification reaction of sodium hydroxide and ethyl acetate
\ce{NaOH + CH3COOC2H5 -> CH3COONa + C2H5OH} \tag{1}
\text{Sodium Hydroxide} + \text{Ethyl Acetate} \longrightarrow \text{Sodium Acetate} + \text{Ethyl Alcohol}
is elementary as written. The rate equation is given by -r_A = k C_A C_B, Where, A is , and B is . We would like to determine the rate constant k using a batch system.
Experimental procedure
The experiment will be carried out in a transparent batch reactor (Armfield Limited, model: CEB-MKIII). Refer to the instruction manual for the reactor setup to understand more about the experimental setup. A virtual tour is also provided that describes the setup in detail.
For this experiment, Reactions are monitored by conductivity probe as the conductivity of the solution changes with conversion of the reactants to product. The reaction eventually reaches steady state when a certain amount of conversion of the starting reagents has taken place. The steady state conditions will vary depending on concentration of reagents, stirrer speed, volume of reactor and temperature of reaction. This experiment will be repeated at various temperatures to investigate the relationship between the specific rate constant and the temperature of reaction.
Steps
Prepare 500ml 0.05M sodium hydroxide and 500ml 0.05M ethyl acetate.
Open Armfield Software and choose ‘Isothermal operation’.
Set up the Hot Water Circulator and adjust the set point of the PID to 30°C.
Add 500ml of the sodium hydroxide solution into the batch reactor.
Set the reactor agitator to ‘50%’ and press ‘Power on’ to start the agitation. Then press ‘Hot Water Circulator’ and water will start to recirculate through jacket reactor and vessel.
After temperature reaches 30 ^{\circ}C, add 500ml EtAc. Start record data.
The degree of conversion of the reagents affects the conductivity of the reactor contents so recording the conductivity over time can be used to calculate the amount of conversion. Collection of data will be until a stable condition is reached in the reactor and this takes approximately 30 minutes. It is advisable to set the data collection period to, say, 45 minutes.
Switch on the Hot Water Circulator. The temperature of the sodium hydroxide in the reactor vessel will begin to rise and will be automatically maintained at the desired set-point (30 ^{\circ}C in this instance) by the action of the HWC in the jacket
To obtain data at different temperatures, we repeat the experiment at 25 ^{\circ}C and 35 ^{\circ}C.
Top up the level of this vessel as necessary to maintain the level above the tip of the level electrode (typically 20 mm from the top of the vessel).
As the experiment involves the collection and storage of conductivity data, the data output port in the plinth must be connected to the computer with Armfield Interface data logger. This will enable data logging of the conductivity, temperatures and stirrer speed values at selected time intervals over a selected period. Ensure the conductivity and temperature sensors have both been installed in accordance with the Installation section. When operating isothermally the temperature sensor T2 supplied with CEXC should be set as the temperature sensor to be controlled in the PID loop box on the software. This sensor must be immersed in the vessel of the Hot Water Circulator. The T1 temperature sensor can be used to follow the temperature in the reactor.
Data analysis
Having recorded the conductivity of the contents of the reactor over the period of the reaction, the conductivity measurements must now be translated into degree of conversion of the constituents. Both sodium hydroxide and sodium acetate contribute conductance to the reaction solution whilst ethyl acetate and ethyl alcohol do not. The conductivity of a sodium hydroxide solution at a given concentration and temperature however, is not the same as that of a sodium acetate solution at the same molarity and temperature and a relationship has been established allowing conversion to be inferred from conductivity.
On conclusion of the experiment, the set of readings of conductivity with time are obtained. The calculations required for converting the conductivity data into concentration are given in the instruction manual “CEB-MKIII Issue 3 Instruction Manual.pdf”
Theoretical analysis
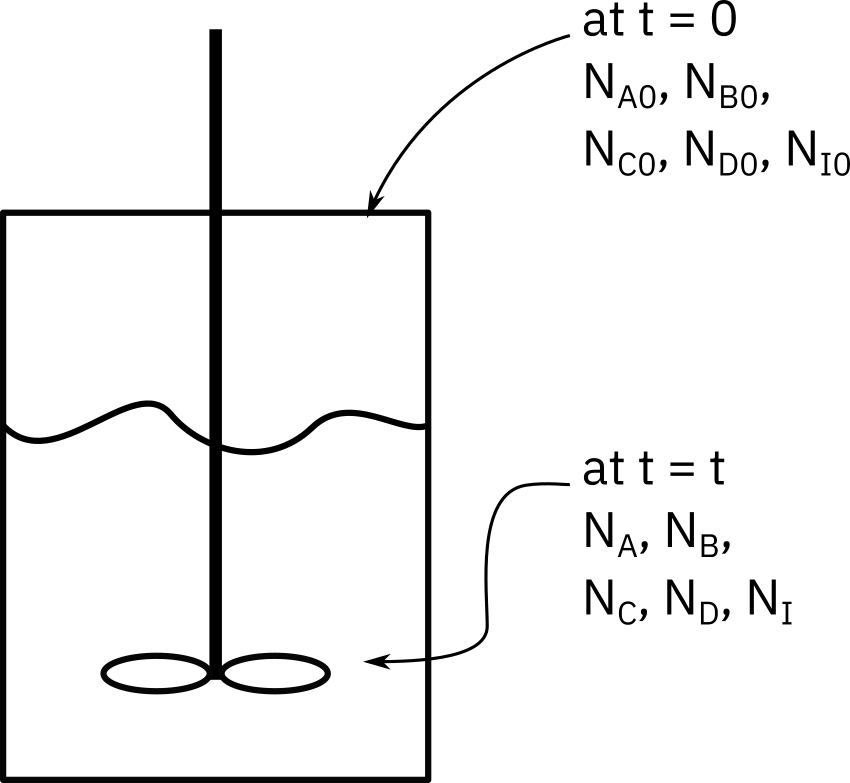
Consider a batch reactor as shown in Figure 1 below.
We establish a mole balance for the reaction in this reactor.
The mole balance is written as
\frac{dN_A}{dt}=r_A V \tag{2}
Let,
N_{A_0} : No. of moles of A initially present
X : Conversion at time t
N_{A_0}X : No. of moles of A consumed at time t
N_{A} : No. of moles of A in system at time t
N_{A} = N_{A_0}-N_{A_0}X = N_{A_0}(1-X)
Stoichiometric table
The stoichiometric table is given in Table 1.
| Species | Initially (mol) | Change (mol) | Remaining (mol) |
|---|---|---|---|
| A | N_{A_0} | -N_{A_0}X | N_A = N_{A_0} - N_{A_0}X |
| B | N_{B_0} | -(b/a)N_{A_0}X | N_B = N_{B_0} -(b/a)N_{A_0}X |
| C | N_{C_0} | (c/a)N_{A_0}X | N_C = N_{C_0} +(c/a)N_{A_0}X |
| D | N_{D_0} | (d/a)N_{A_0}X | N_D = N_{D_0} +(d/a)N_{A_0}X |
| I | N_{I_0} | 0 | N_I = N_{I_0} |
| Total | \mathbf{N_{T_0}} | \mathbf{N_T = N_{T_0} + \delta N_{A_0}X} |
\delta = +\frac{d}{a}+\frac{c}{a}-\frac{b}{a}-1
Equations for the concentration in a batch system
C_A = \frac{N_A}{V} = \frac{N_{A_0}(1-X)}{V} C_B = \frac{N_B}{V} = \frac{N_{B_0}-(b/a)N_{A_0}X}{V} C_C = \frac{N_C}{V} = \frac{N_{C_0}+(c/a)N_{A_0}X}{V} C_D = \frac{N_D}{V} = \frac{N_{D_0}+(d/a)N_{A_0}X}{V}
For a constant volume batch reactor, V = V_0. Let \phi_i = N_{i_0}/N_{A_0} = C_{i_0}/C_{A_0}. Then,
C_A = C_{A_0}(1-X) C_B = C_{A_0}(\phi_B-(b/a)X) C_C = C_{A_0}(\phi_C+(c/a)X) C_D = C_{A_0}(\phi_D+(d/a)X)
Rate expression
-r_A = k C_A C_B -r_A = k C_{A_0}^2 (1-X) (\phi_B-(b/a)X)
For C_{A_0}= C_{B_0}, and b/a = 1
-r_A = k C_{A_0}^2 (1-X)^2
Therefore, mole balance (Equation 2) becomes
\frac{dC_A}{dt}=-k C_{A_0}^2 (1-X)^2 \tag{3}
as C_A = C_{A_0}(1-X); dC_A = -C_{A_0} dX
The mole balance (Equation 3) can then be written as
\frac{dX}{(1-X)^2}=k C_{A_0} dt
Integrating,
\int_0^x \frac{dX}{(1-X)^2} = \int_0^t k C_{A_0} dt
\frac{X}{1-X} = k C_{A_0} t
\left[\frac{C_{A_0}-C_A}{C_A} \right] \left[\frac{1}{C_{A_0}(1-X)} \right]= k t
\frac{C_{A_0}-C_A}{C_A C_{A_0}} = k t \tag{4}
Equation 4 shows that a plot of \frac{C_{A_0}-C_A}{C_A C_{A_0}} \text{ with } t is a straight line with a slope of k.
Tasks
Prepare a report based on your interpretation of experimental data. The report should consider the following:
List the assumptions made in analysis of the system (Section 4)
Data analysis
- Perform data analysis in Excel to analyze the data for three different temperatures.
- Based on the analysis, report the reaction rate constants at the three different temperatures, and the activation energy for the reaction.
- Present relevant graphs for all the data sets.
Citation
@online{utikar,
  author = {Utikar, Ranjeet},
  title = {Experiment 1: {Batch} {Saponification} {Reaction} of {Et(Ac)}
    and {NaOH}},
  url = {https://cre.smilelab.dev/content/labs/Experiment-01-Batch-Saponification-Reaction-of-EtAc-and-NaOH/},
  langid = {en}
}